Gleniti Golf Course
Canterbury · 20 greens mapped · Official website
Read these greens →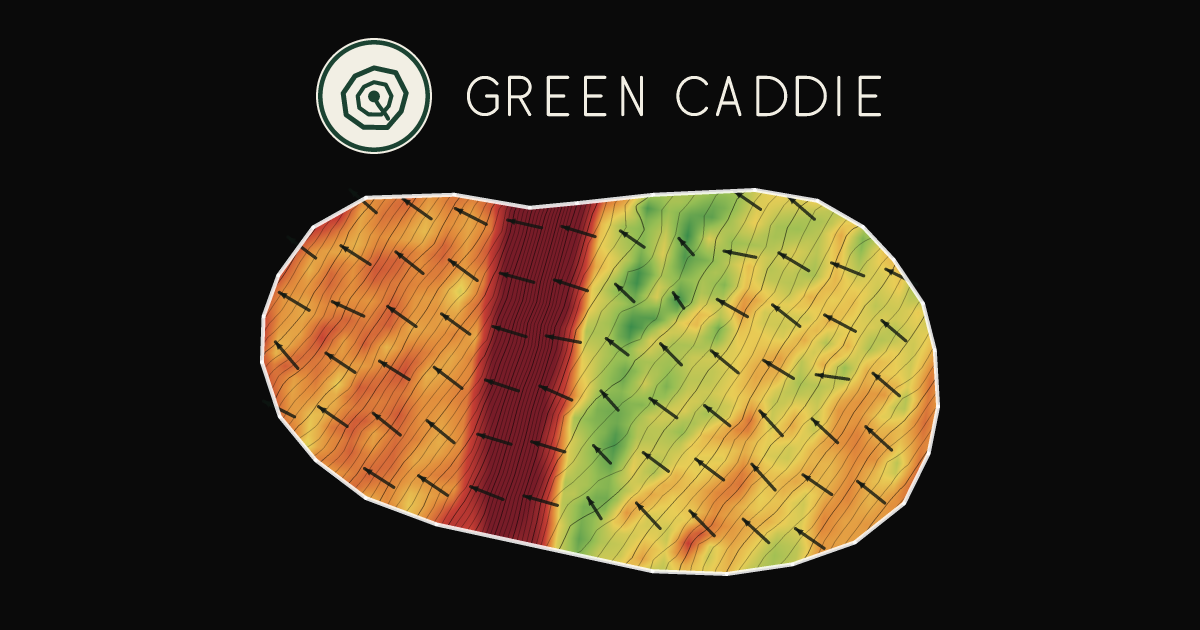
The greens here
20 greens at Gleniti have been mapped from the national LiDAR survey — 7,037 m² of putting surface altogether, with a median green of 343 m². The national median is 397 m², so these run 14% smaller than average.
- Steepest green: hole 1, averaging 6.2% and falling north.
- Flattest green: hole 3, at 1.0%.
- Most internal fall: hole 1, 1.82 m between its low and high point.
- Largest green: hole 2, 464 m².
Every green
| Green | Size | Fall | Avg grade | Runs off to the |
|---|---|---|---|---|
| Hole 1 | 450 m² | 1.82 m | 6.2% | north |
| Hole 2 | 464 m² | 0.89 m | 2.6% | south-east |
| Hole 3 | 399 m² | 0.55 m | 1.0% | south-east |
| Hole 4 | 320 m² | 0.67 m | 2.6% | north |
| Hole 5 | 438 m² | 0.54 m | 2.0% | south-east |
| Hole 6 | 328 m² | 0.65 m | 3.1% | south |
| Hole 7 | 311 m² | 0.75 m | 3.6% | south-east |
| Hole 8 | 299 m² | 0.94 m | 3.7% | south-east |
| Hole 9 | 358 m² | 0.53 m | 2.5% | south-east |
| Hole 10 | 379 m² | 0.86 m | 4.0% | north-east |
| Hole 11 | 453 m² | 0.72 m | 2.9% | south-east |
| Hole 12 | 403 m² | 0.62 m | 2.8% | south-east |
| Hole 13 | 272 m² | 0.63 m | 3.8% | south |
| Hole 14 | 311 m² | 0.73 m | 3.2% | north-east |
| Hole 15 | 233 m² | 1.09 m | 6.0% | south |
| Hole 16 | 308 m² | 0.78 m | 3.7% | east |
| Hole 17 | 432 m² | 0.47 m | 1.5% | south-east |
| Hole 18 | 328 m² | 0.88 m | 3.5% | north-east |
| Green A | 187 m² | 0.43 m | 1.7% | east |
| Green B | 362 m² | 0.49 m | 2.1% | south |
“Fall” is the height difference between the lowest and highest point of the putting surface. “Avg grade” is the best-fit plane across it — a green can average 2% and still have a shelf on it, which is what the app shows and a table cannot.
Slope is measured. Break is modelled.